![]()
Plot subsurface variables#
# # skip this if package has already been installed
# !pip install modvis
%matplotlib inline
%load_ext autoreload
%autoreload 2

import os
import numpy as np
import modvis.ats_xdmf as xdmf
import modvis.plot_vis_file as pv
import logging
logging.basicConfig(level=logging.INFO, format='%(asctime)s - %(name)s - %(levelname)s: %(message)s')

work_dir = f"../../model2/"
run_dir = "3-transient"
model_dir = os.path.join(work_dir, run_dir)
logging.info(f"Loading data from {model_dir}")
# model_dir = "../data/coalcreek"
2025-04-07 15:02:18,146 - root - INFO: Loading data from ../../model2/3-transient
# import numpy as np
# import modvis.ats_xdmf as xdmf
# import modvis.plot_vis_file as pv

# model_dir = "../data/coalcreek"
Download the sample data when running on Google Colab
# import os
# if not os.path.exists(model_dir):
#   !git clone https://github.com/pinshuai/modvis.git
#   %cd ./modvis/examples/notebooks
import vis data#
visfile = xdmf.VisFile(model_dir, domain=None, load_mesh=True, columnar=True,
                      model_time_unit= 'd')
# all available variable names
list(visfile.d.keys())
['base_porosity',
 'capillary_pressure_gas_liq',
 'cell_volume',
 'darcy_velocity.0',
 'darcy_velocity.1',
 'darcy_velocity.2',
 'mass_density_liquid',
 'molar_density_liquid',
 'permeability',
 'plant_wilting_factor',
 'porosity',
 'pressure',
 'relative_permeability',
 'root_fraction',
 'saturation_gas',
 'saturation_liquid',
 'transpiration',
 'viscosity_liquid',
 'water_content',
 'water_source']
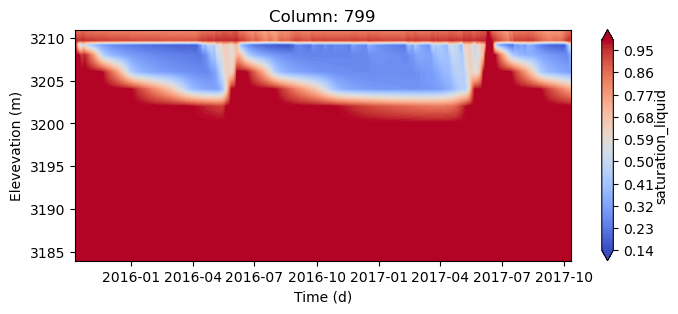
plot subsurface satuation#
single column#
This will print a variable across a single column over the entire simulation period. The user needs to provide cell ids associated with the column.
The cell ID can be found using ParaView with the following steps:
Load data into Paraview. Click
applyClick on
SplitViewicon and chooseSpreadSheetViewUnder
SpreadSheetView, change Attribute toCell Data; Toggle onShow only selected elements(next to the Precision)Under
RenderView, turn onInteractively select cells onSelect cells of interests and the spreadsheet will be auto populated the cell attributes with the first column being
Cell IDProvide the
Cell IDinpv.plot_column_data().
fig, ax = pv.plot_column_data(visfile, var_name = "saturation_liquid", cmap = "coolwarm",
                              cell_id = 23316, infer_col_from_cell=True)
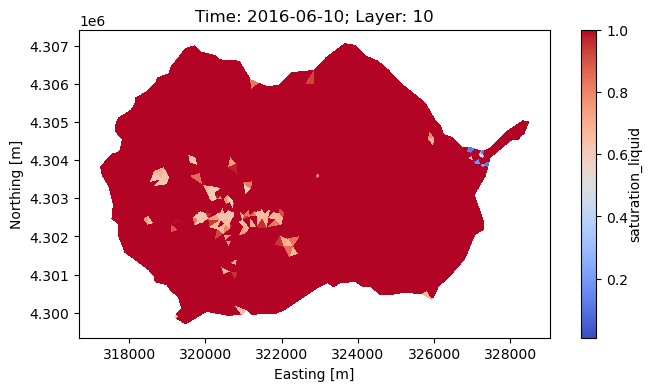
single layer#
time_slice = '2016-6-10'
fig, ax = pv.plot_layer_data(visfile, var_name = "saturation_liquid",
                             layer_ind = 9, time_slice= time_slice,
                          cmap = "coolwarm")
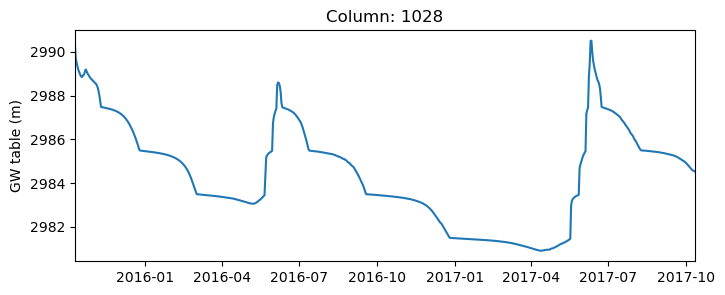
plot groundwater table#
single column#
ihead = pv.plot_column_head(visfile, cell_id = 22903, infer_col_from_cell=True)
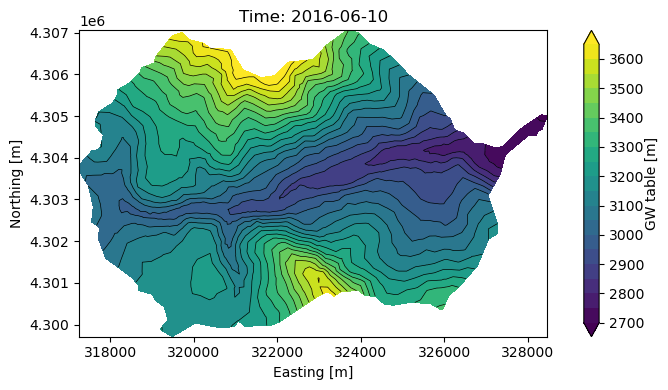
GW surface#
fig, ax, tpc = pv.plot_gw_surface(visfile, contour = True,
                                  contourline = True, nlevel = np.arange(2700,3665, 50),
                                  colorbar = True,
                                  time_slice = time_slice,
                                 )
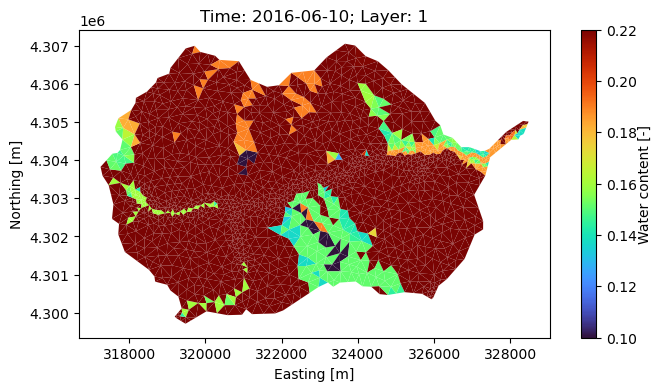
Volumetric water content#
fig, ax, tpc = pv.plot_water_content(visfile, layer_ind = 0,
                                     vmin = 0.1, vmax = 0.22, cmap = 'turbo',
                                     time_slice=time_slice)